Why Social Media Engagement Benchmarks Matter More Than Ever
For solopreneurs, startups, and small businesses, social media can feel overly subjective. One brand posts twice a week and gets hundreds of comments. Another posts daily and hears nothing. The natural question becomes:
“Is my engagement actually bad or am I comparing myself to the wrong benchmark?”
This is where social media engagement rate benchmarks become essential.
Engagement rate is no longer a “nice-to-have” metric. It is one of the strongest indicators of:
- Content relevance
- Audience quality
- Algorithmic visibility
- Long-term brand health
Yet most small businesses misunderstand social media benchmarks, compare across industries incorrectly, or chase unrealistic averages that damage strategy instead of improving it.
This guide breaks down:
- What social media engagement rate really measures
- The average social media engagement rate across platforms
- Industry benchmarks for social media, including Instagram
- Which industries consistently win, which struggle, and why
- How startups and SMBs should use benchmarks to shape content strategy
What Is Social Media Engagement Rate (And Why It’s the Most Reliable Metric)
Definition
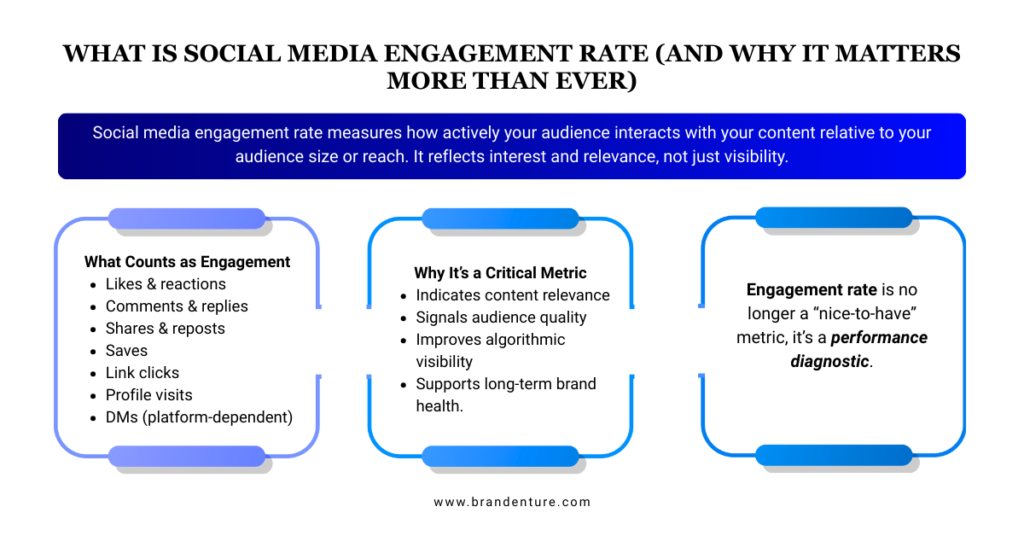
Social media engagement rate measures how actively an audience interacts with your content relative to your audience size or reach.
It reflects interest, not just visibility.
What Counts as Engagement?
Depending on the platform, engagement includes:
- Likes & reactions
- Comments & replies
- Shares & reposts
- Saves
- Link clicks
- Profile visits
- DMs (on some platforms)
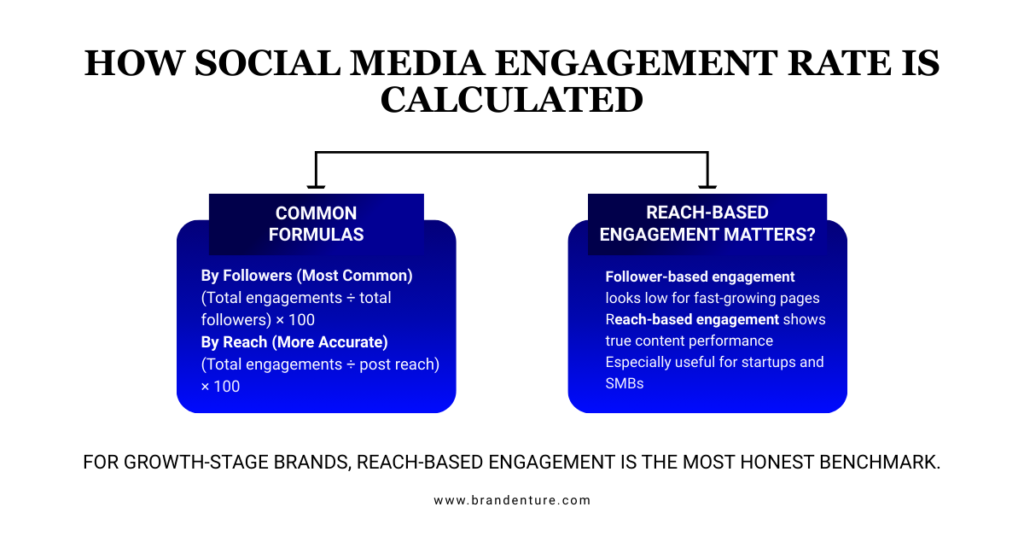
Common Engagement Rate Formulas
By Followers (most common):
(Total engagements ÷ total followers) × 100
By Reach (more accurate for growth-stage brands):
(Total engagements ÷ post reach) × 100
Why this matters:
Follower-based engagement can look low for fast-growing pages, while reach-based engagement shows true content performance.
For startups and SMBs, reach-based engagement rate is often the most honest benchmark engagement rate.
Understanding Social Media Benchmarks (How Averages Are Actually Calculated)
A social media engagement rate benchmark is not a goal, it’s a reference point.
Benchmarks are typically calculated using:
- Large datasets across thousands of accounts
- Median or average engagement per industry
- Platform-level analytics aggregated by niche
Why Benchmarks Vary So Widely
Engagement rates differ based on:
- Industry (emotional vs functional content)
- Platform intent (Instagram ≠ LinkedIn)
- Audience maturity
- Content format (Reels vs static posts)
- Account size
⚠️ Critical insight for small businesses:
Comparing a B2B SaaS startup to a lifestyle creator is not benchmarking, it’s self-sabotage.
Average Social Media Engagement Rate by Platform (Baseline Expectations)
Platform-Wide Average Engagement Rates
| Platform | Average Social Media Engagement Rate |
| 0.6% – 1.2% | |
| 0.15% – 0.3% | |
| 1.8% – 3.5% | |
| X (Twitter) | 0.05% – 0.2% |
| TikTok | 4% – 7% |
📌 These are cross-industry averages, not targets.
Why Instagram Benchmarks Are Often Misunderstood
Instagram has the widest engagement variance of any platform.
Why?
- Reels are discovery-driven
- Carousels drive saves
- Static posts rely heavily on existing audience
- Stories prioritize retention, not engagement
This means average engagement rate for Instagram must always be evaluated by:
- Content format
- Industry
- Account size
Social Media Engagement Rate Benchmarks by Industry
This is where benchmarks become useful.
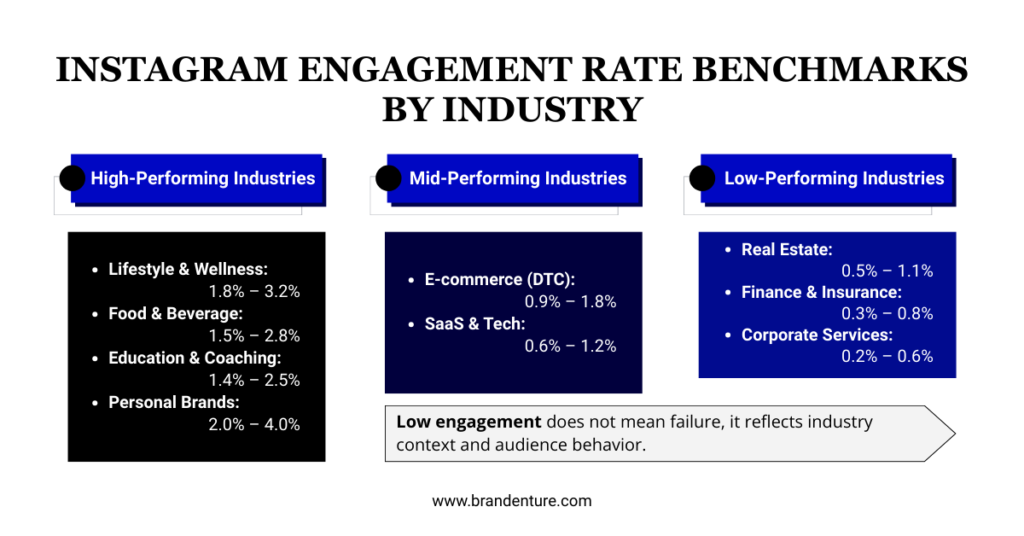
Industry Engagement Rate Benchmarks (Instagram-focused)
| Industry | Average Engagement Rate (Instagram) | Performance Tier |
| Lifestyle & Wellness | 1.8% – 3.2% | Winner |
| Food & Beverage | 1.5% – 2.8% | Winner |
| Education & Coaching | 1.4% – 2.5% | Winner |
| Personal Brands | 2.0% – 4.0% | Winner |
| E-commerce (DTC) | 0.9% – 1.8% | Mid |
| SaaS & Tech | 0.6% – 1.2% | Mid |
| Real Estate | 0.5% – 1.1% | Low |
| Finance & Insurance | 0.3% – 0.8% | Low |
| Corporate Services | 0.2% – 0.6% | Low |
Winners: Why Certain Industries Consistently Outperform
High-performing industries share common traits:
1. Emotional Relevance
Lifestyle, wellness, and food content triggers identity, aspiration, and daily habits.
2. Visual Storytelling
These industries naturally produce:
- Before/after visuals
- Behind-the-scenes content
- Human-centered narratives
3. Community-Based Engagement
Questions, polls, shared experiences, and UGC are easy to generate.
Takeaway for startups:
You don’t need to be in a “winning industry” , you need to adopt winning content behaviors.
Losers: Why Some Industries Struggle With Engagement
Low-performing industries aren’t bad businesses, they’re context-heavy.
Common Challenges:
- Low emotional connection
- Compliance restrictions
- High trust requirement before interaction
- Content feels transactional, not relational
Finance, real estate, and B2B services often see lower average social media engagement rates, but this does not mean social media isn’t working.
📌 In these industries, saves, shares, and DMs matter more than likes.
Patterns That Separate High-Engagement Brands From Low-Engagement Ones
Across industries, high performers consistently:
- Educate before selling
- Use founder-led or human-first content
- Repurpose one idea across multiple formats
- Optimize for saves and shares, not likes
- Speak to one pain point per post
Low performers often:
- Post promotional content too frequently
- Chase viral formats without relevance
- Compare engagement rates across unrelated industries
Why Small Businesses Misuse Engagement Benchmarks
The most common mistakes:
- Comparing themselves to creators or large brands
- Using global averages instead of industry social media benchmarks
- Expecting high engagement with low posting consistency
- Ignoring audience intent
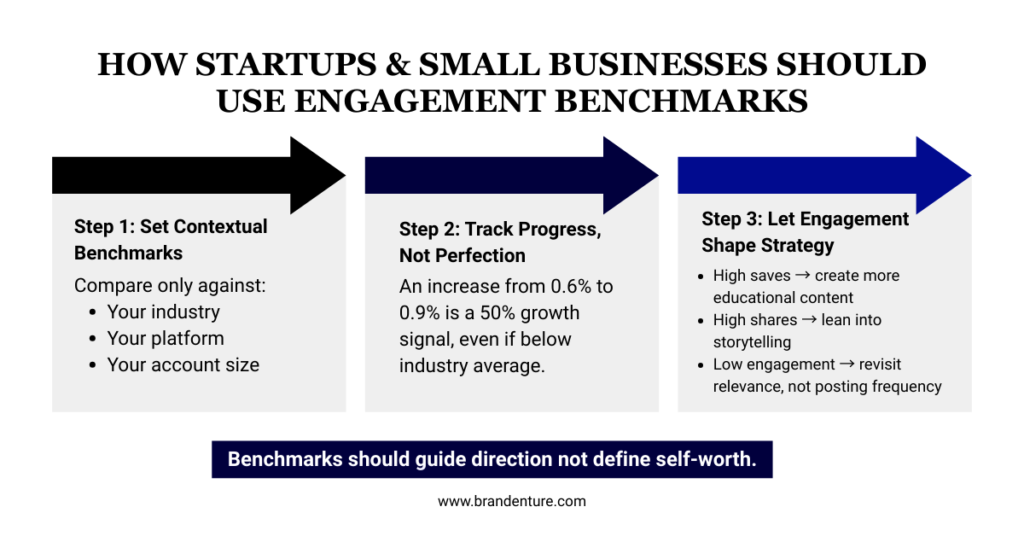
Benchmarks should guide direction, not define self-worth.
How Startups & SMBs Should Use Engagement Benchmarks Strategically
1. Set Contextual Benchmarks
Compare only against:
- Your industry
- Your platform
- Your account size
2. Track Progress, Not Perfection
If your engagement rate improves from 0.6% to 0.9%, that’s a 50% growth signal, even if it’s below industry average.
3. Use Engagement to Shape Content Strategy
- High saves → create more educational content
- High shares → lean into storytelling
- Low engagement → revisit audience relevance, not posting frequency
Engagement Rate vs Business Growth: The Reality
High engagement does not always equal sales.
Low engagement does not always mean failure.
Engagement rate should be used as:
- A diagnostic tool
- A content relevance indicator
- An algorithm visibility signal
Not as a vanity metric.
Final Thoughts: Benchmarks Are a Compass, Not a Scorecard
Social media engagement rate benchmarks exist to provide clarity, not pressure.
For solopreneurs, SMBs, and startups:
- Context matters more than averages
- Strategy matters more than trends
- Consistency matters more than virality
The brands that win are not those with the highest engagement rates, but those who understand why their engagement looks the way it does and act accordingly.
👉 Struggling to interpret your engagement metrics or benchmark your performance correctly?
At Brandenture, we help startups and small businesses:
- Decode social media engagement data
- Build content strategies aligned with industry benchmarks
- Turn engagement into sales machine and long-term brand growth a
📩 Book a free strategy call and get a personalized engagement benchmark analysis for your industry.
FAQs
A good social media engagement rate depends on the platform and industry. On average, most brands see an engagement rate between 0.5% and 1.5%, while high-performing industries like lifestyle, education, and personal brands often exceed 2%. Engagement should always be evaluated against industry social media benchmarks, not global averages.
The average social media engagement rate varies significantly by industry. For example, lifestyle and wellness brands often achieve 1.8%–3%, while SaaS, finance, and corporate services typically fall between 0.3%–1%. Industry context is critical when evaluating performance.
The average engagement rate for Instagram across industries typically ranges from 0.6% to 1.2%. However, industries such as personal branding, education, and food often perform above average, especially when using Reels and carousel content.
Social media engagement rate is calculated by dividing total engagements (likes, comments, shares, saves) by either total followers or post reach, then multiplying by 100. For growing brands, calculating engagement rate by reach provides a more accurate benchmark engagement rate.
Social media benchmarks are industry-based performance averages used to compare metrics such as engagement rate, reach, and growth. They help businesses understand whether their performance is above, below, or within the normal range for their specific industry.
A social media engagement rate benchmark is an industry-specific average used to evaluate how well content performs compared to similar brands. It provides context for engagement metrics and helps businesses set realistic performance expectations.
Engagement rate differs by industry due to factors like emotional relevance, content format, buying intent, and audience behavior. Industries that rely on storytelling and visual content generally see higher engagement than highly regulated or technical industries.